Industry Resources

Cleanroom Classification

Cleanrooms are classified according to the cleanliness level of the air inside them. The cleanroom class is based on the number and size of particles permitted per volume of air.  The basis of cleanroom standards is the micrometer or micron for short (µm) which is the size of the particles to be filtered.   The cleanroom classification tables show the maximum concentration limits for particles equal to and larger than the considered sizes shown.

For a period of time the Federal Standard 209E was followed in the USA.  This standard included the cleanroom classes Class 1, Class 10, Class 100, Class 1,000, Class 10,000 and Class 100,000.  This standard denoted the number of particles of size 0.5 µm or larger permitted per cubic foot of air.

Now the primary authority in the USA and Canada is the ISO classification system ISO 14644-1. This standard specifies the decimal logarithm of the number of particles 0.1 µm or larger permitted per cubic meter of air.  Under this standard there are three more cleanroom classes ~ ISO 1, ISO 2, ISO 3, ISO 4, ISO 5, ISO 6, ISO 7, ISO 8 and ISO 9.  ISO 1 is the “cleanest” rating and ISO 9 is the “dirtiest” rating (but still cleaner than a regular room). The most common classes are ISO 7 and ISO 8.

In addition, cleanrooms must also comply with industry-specific and regional standards. For example, EU GGMP (A-B-C-D) applies to pharmaceutical products and USP (795, 797 and 800) to compounding pharmacies.
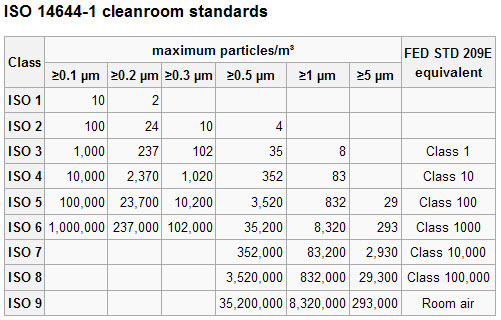
Clean-Room ISO Standards Chart

As an example for ISO 7 classification, particles smaller than 0.5 microns (≥0.1 µm, ≥0.2 µm, ≥0.3 µm) are not taken into consideration. The concentration of particles of ≥0.5 µm and above should be below 352,000, for particles of 1 micron and above 83,200 or lower and for particles of 5 microns and above 2,930 or lower.

Industry Acronyms

Commonly used acronyms in the industry.  As new acronyms are defined, this document will be updated.

Surface Finish Table

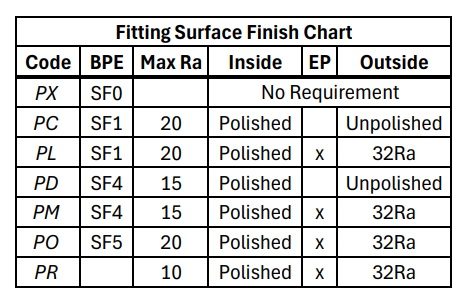
Surface roughness is the measurement of the relative smoothness of a surface’s profile, calculated via the microscopic deviations in a surface’s true form.  A common unit of measurement of surface roughness is by measuring the “average roughness”, which is often communicated as “Ra”. Ra is the calculated average between peaks and valleys on a surface.

The lower the Ra value, the less variation between the peaks and troughs on a surface, making the surface smoother.  With a higher Ra value, the surface would be highly textured and coarser and therefore potentially unsuitable for the desired use. This contrast of Ra values illustrates the importance of determining the desired surface roughness of a product before the manufacturing process begins.

Fitting Surface Finish Chart

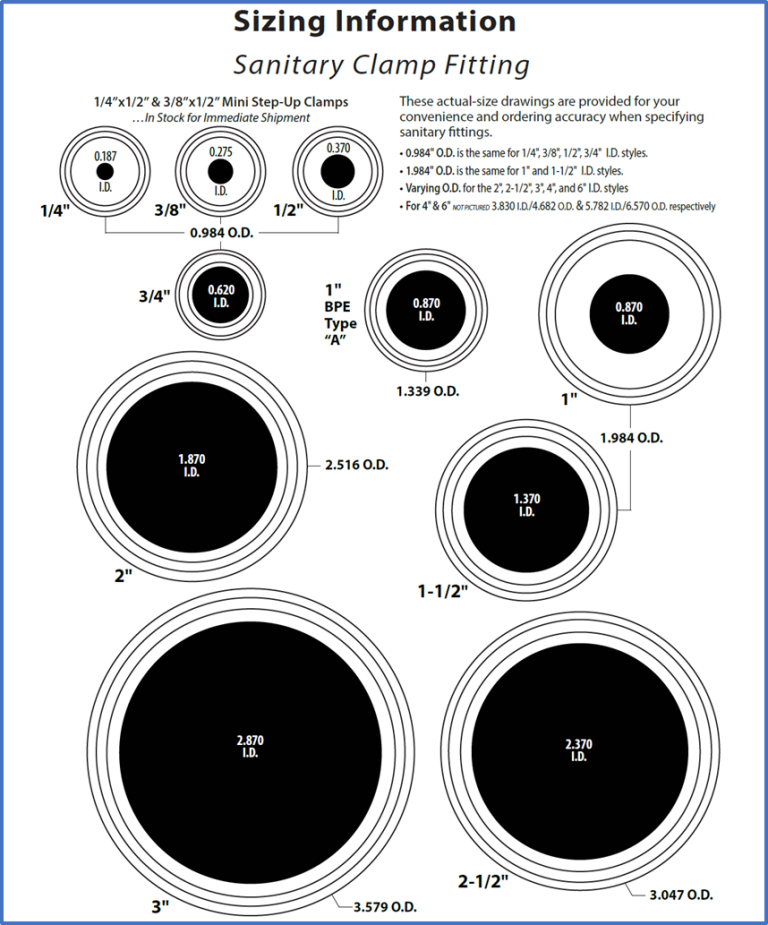
Sanitary Tri-Clamps Sizing

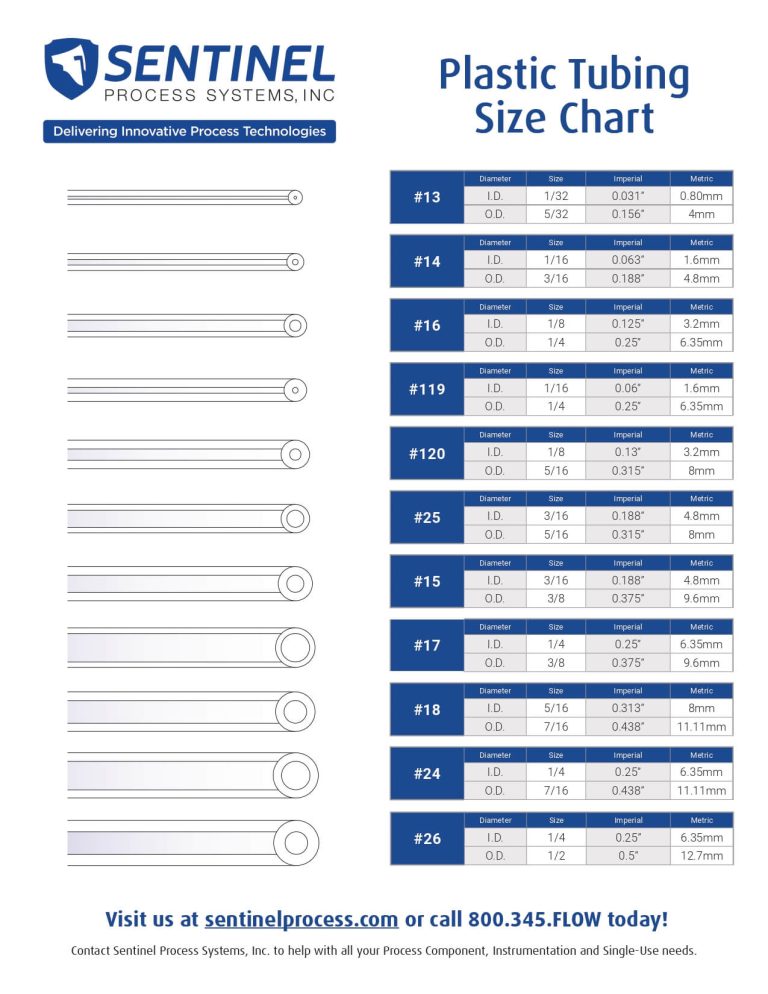
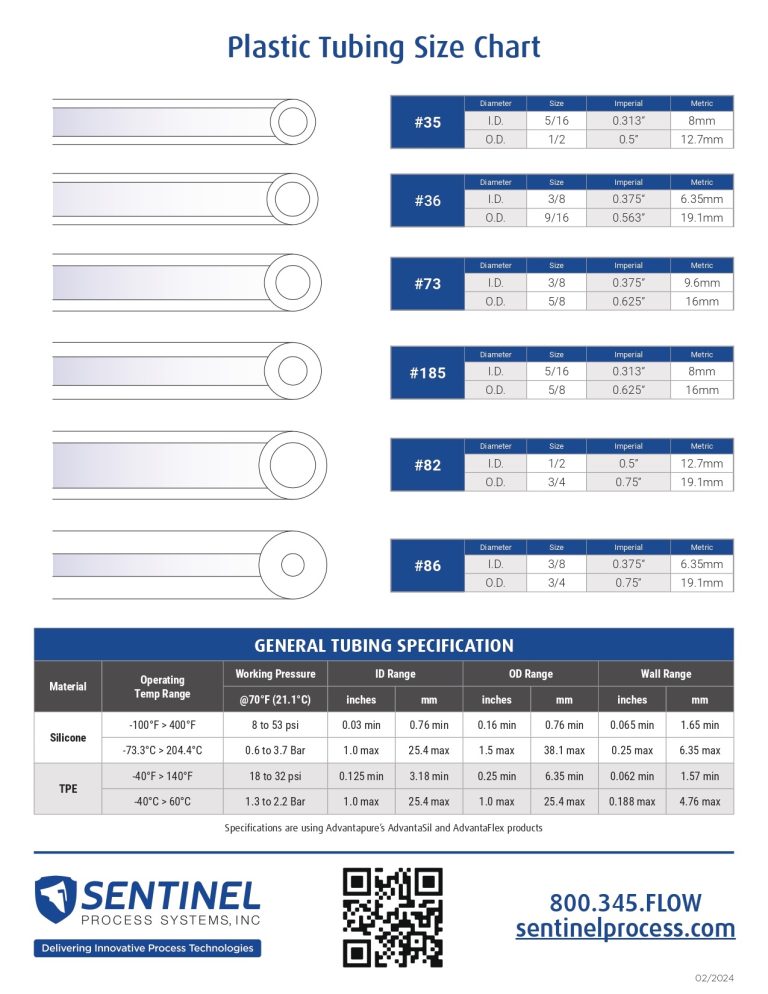
Plastic Tubing Size Chart

Tubing Size Chart
Tubing Size Chart page 2

Start Solving Your Process Challenges Today